
Adding Pivots Points Algo into your chart
Start by opening Tradingview and selecting a chart where you wish to add the Pivot Points Algo.
Once you’ve subscribed to Pivot Points Algo, you’ll gain access to the indicator. The next steps involve adding it to your chosen chart on Tradingview, as outlined below (refer to the image below for clarification):
- Open the list of indicators (#1 in the image). You can do this by clicking on the ‘Indicators’ button situated at the top of the chart menu.
- Search for Pivot Point Algo. In the search field, type “PPA” (#2) or navigate to the “Invite-only scripts” tab and click on”Pivot Points Algo” to add it to your chart.
![]() Please note, in addition to Pivot Points Algo, any package purchased also includes free access to the DTrendmeter and XRAY indicators. These can be found and added from the ‘Invite-only scripts’ list.”
Please note, in addition to Pivot Points Algo, any package purchased also includes free access to the DTrendmeter and XRAY indicators. These can be found and added from the ‘Invite-only scripts’ list.”
Adding Pivot Points Algo example: Simply type “PPA” in the search input.

Signal Types
- Main Signals – These are represented by labels. Their primary function is to detect the beginning of an upward or downward trend.”

- Mini Signals – Mini Signals, shown as small triangles only appear after a Main Signal and indicate additional breakout chances aligned with the Main Signal’s direction.

Example Chart:

![]() The Mini signals will only appear in the same direction as the main signal.
The Mini signals will only appear in the same direction as the main signal.
For example, if a Main Signal is ‘BUY’, then all the following Mini Signals will also be ‘BUY’ giving additional opportunities to enter a trade. If a Main Signal is ‘SELL’, all the following Mini Signals will be also ‘SELL’.
![]() In the example chart, we use colored candles. Green bars mean prices are going up, and red bars mean prices are going down. You can read more about this in the ‘Color Bars’ section.
In the example chart, we use colored candles. Green bars mean prices are going up, and red bars mean prices are going down. You can read more about this in the ‘Color Bars’ section.
Breakout Lines and Breakout Price
By default, signal breakouts display a pivot line to show you exactly where and at what price the breakout occurred to give you a precise entry.
MAIN Signal pivot line appears as a 2-pixel line (wider line).
MINI Signal pivot line appears as 1 pixel (thin line).
![]() False breakouts are plotted as dashed thin lines. More on false breakouts.
False breakouts are plotted as dashed thin lines. More on false breakouts.
![]() The color of the line will change according to the type of signal – by default green for buy and red for sell.
The color of the line will change according to the type of signal – by default green for buy and red for sell.
Understanding Breakout Lines and Prices
The system automatically shows a pivot line at the exact price and point of each signal breakout, providing you with a precise entry spot.
The pivot line for MAIN Signals is a bit wider (2-pixels) while for MINI Signals, it’s a thin line (1-pixel).
Sometimes, there are false breakouts; these are shown as dashed thin lines. You can read more about false breakouts in its dedicated section.
Also, the line color changes based on the signal type: by default, green lines mean ‘buy’ and red lines mean ‘sell’.”
Options for pivot breakout lines and breakout price labels:
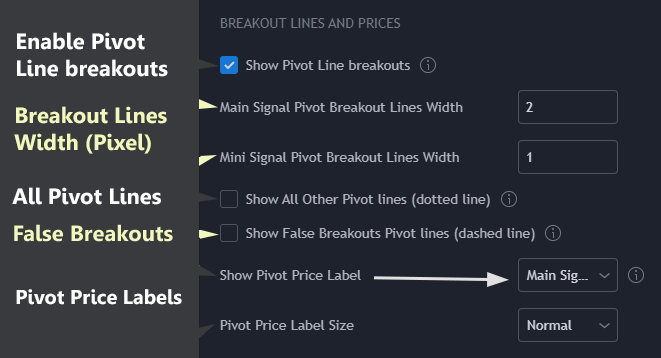
![]() The ‘Show Pivot Price Label’ option is not turned on by default. If you switch this option on, you will see the price value at every breakout, either above or below the pivot line.
The ‘Show Pivot Price Label’ option is not turned on by default. If you switch this option on, you will see the price value at every breakout, either above or below the pivot line.
Example Chart:

![]() If you wish to view all PPA pivot lines that didn’t result in a breakout (these are displayed as dotted lines), you can do so by enabling the ‘Show All Other Pivot lines (dotted line)’ option in the indicator settings.
If you wish to view all PPA pivot lines that didn’t result in a breakout (these are displayed as dotted lines), you can do so by enabling the ‘Show All Other Pivot lines (dotted line)’ option in the indicator settings.
Sensitivity
Adjusting the sensitivity in PPA lets you tailor the tool to match your trading style. With the latest update, the manual settings for adjusting sensitivity have been removed, simplifying the process and enhancing the algorithm’s efficiency.
You can now select from the following sensitivity presets to align PPA with your trading strategy:
- Lowest – Previously known as ‘Low’ in earlier versions, offers the least sensitivity, generating fewer signals.
- Low – Offers reduced sensitivity compared to ‘Normal’, suitable for traders seeking fewer, more significant signals.
- Normal – The default setting, providing a balanced number of signals.
- Max – The highest sensitivity setting, generating the maximum number of signals.

These presets are designed to accommodate various trading styles, from conservative to aggressive, by automatically adjusting the algorithm’s sensitivity to pivot movements. This update aims to streamline the trading experience, allowing you to focus more on strategy and less on configuration.
As always, we recommend experimenting with these presets to find the one that best fits your approach to trading. Remember, the goal is to align the tool with your strategy to enhance decision-making and potential profitability.
For additional details on other features, such as stop-loss settings and the OTC NoiseFilter, please refer to the respective sections of our documentation.
OTC NoiseFilter
The OTC NoiseFilter serves to filter out false breakouts for both MAIN and MINI signals. It comes in three variants:
- None
- Normal
- Strong
- None: This variant provides no noise filter. Hence, breakouts will prompt main signals without any form of filtering.
- Normal: This variant offers moderate filtering. It eliminates some false breakouts, primarily focusing on candle pattern changes.
- Strong: This variant ensures a robust filtering process, taking into account volume changes alongside other factors.
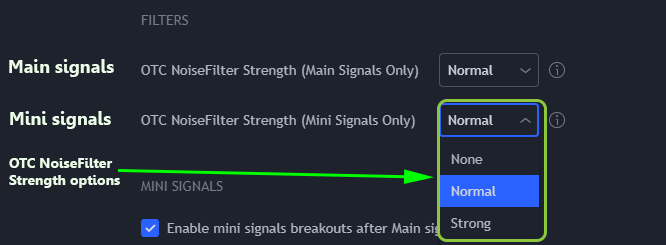
![]() You can try out various OTC NoiseFilter settings to see what best fits your trading style. Remember, stronger filters are designed to filter out false breakouts, which means you’ll get fewer signals as a result.
You can try out various OTC NoiseFilter settings to see what best fits your trading style. Remember, stronger filters are designed to filter out false breakouts, which means you’ll get fewer signals as a result.
Stop Loss
PPA provides a comprehensive set of stop loss options, designed for diverse trading strategies to mitigate losses and protect gains effectively.

Stop Loss Types:
- None – Disables the stop loss feature, not applying any stop loss strategy.
- Fixed – Sets a stop loss at a specified percentage from the entry price, offering a static level of protection.
- Trailing Percentage – Adjusts the stop loss level dynamically based on market movements to protect profits and limit losses.
- Trailing SAR – Implements a stop loss that follows price movements according to the SAR (Stop and Reverse) indicator, providing a dynamic and responsive approach to risk management.
- Trailing Pivot – Uses high or low pivot points to adjust stop loss levels, allowing for movement-based adjustments that reflect current market conditions.
Base Settings:

The ‘Maximum percentage loss’ parameter is central to configuring your stop loss strategy. It determines the maximum loss you are prepared to accept on a trade.
Auto-Calculate Stop Loss: When enabled, the Auto-calculate Stop Loss feature automatically calculates the initial stop loss value for ‘Fixed’ and ‘Trailing Percentage’ strategies. Following this automatic calculation, ‘Maximum percentage loss’ acts as a fine-tuning mechanism, allowing for precision adjustments to the auto-calculated stop loss levels. This functionality harnesses historical market volatility to optimize stop loss settings, ensuring they are responsive to current market dynamics.
![]() It’s important to note that while ‘Trailing Pivot’ and ‘Trailing SAR’ stop loss types do not directly utilize the ‘Auto-calculate stop-loss’ feature for initial calculation, the ‘Maximum percentage loss’ can still be applied to manually fine-tune these strategies. This flexibility ensures comprehensive coverage across different trading styles and preferences.
It’s important to note that while ‘Trailing Pivot’ and ‘Trailing SAR’ stop loss types do not directly utilize the ‘Auto-calculate stop-loss’ feature for initial calculation, the ‘Maximum percentage loss’ can still be applied to manually fine-tune these strategies. This flexibility ensures comprehensive coverage across different trading styles and preferences.
Customizing Your Stop Loss:
Understanding and effectively setting the ‘Maximum percentage loss’ is crucial for tailoring the PPA to your risk management needs. Whether automatically calculated for ‘Fixed’ and ‘Trailing Percentage’ or manually adjusted for ‘Trailing Pivot’ and ‘Trailing SAR’, this parameter offers a nuanced control over how your trades are protected against market volatility.
By leveraging these stop loss options and the ‘Maximum percentage loss’ parameter, traders can strike an optimal balance between risk tolerance and profit potential, customizing the PPA to suit their individual trading strategy.


Additional Settings for Trailing Stop Loss
The Trailing Percentage stop loss offers additional settings for increased flexibility.

Percentage to Reduce from the Stop Loss
This feature allows defining a specific percentage to reduce from the stop loss value after each candle, provided the market moves in your favor. This setting, when above 0%, incrementally lowers the risk as the trade becomes profitable, initiating from the second candle following the stop loss setup and continuing for each new candle until it hits a PPA-defined minimum value. Disabling this feature (setting it to 0%) keeps the stop loss percentage constant. Defaults is 0%, indicating it is disabled. For example, if you set the ‘Maximum percentage loss’ to 3% and the ‘Percentage to Reduce from the Stop Loss’ is 5%, from the second candle onward, the stop loss adjustment mechanism will activate. This does not directly deduct 5% from the 3% stop loss but rather applies the reduction dynamically based on the price’s favorable movement. The aim is to incrementally tighten the stop loss to secure profits as the trade moves in a beneficial direction.
Differential Percentage Reduction
This setting is unique to ‘Trailing Percentage’ stop loss type. It enables the stop loss value to be automatically reduced, regardless of whether the market moves in your favor, remains unchanged, or even moves against your position. It requires ‘Percentage to Reduce from the Stop Loss’ to be active and set above 0%. The adjustment relies on the change in ‘Maximum percentage loss’ value from one candle to the next, offering a dynamic approach to safeguard profits or lessen potential losses amidst market volatility.

Trailing SAR
The SAR, short for Parabolic SAR, is usually used as a price trend indicator. In this context, however, we use it as a Trailing Stop to track price movements.
The SAR Trailing method is based on three parameters that you can modify in the PPA settings:
- SAR Start: This sets the initial value from where the SAR begins.
- Step: This is the value by which the SAR increases each time a new high or low extreme point is reached (also known as the ‘Acceleration Factor’).
- Max: This sets the value at which the SAR stops increasing.


Trailing Pivot
The ‘Trailing Pivot’ method tracks the high or low pivot lines relative to our entry position—utilizing high pivots for long positions and low pivots for short positions. Additionally, this method incorporates the ‘Maximum percentage loss’ parameter to adjust the distance from the pivot point, effectively fine-tuning the stop loss level. However, whether the ‘Auto-Calculate Stop Loss’ option is enabled or disabled, it does not affect the ‘Trailing Pivot’ method.
Trailing Pivot Additional Settings

Factor to Reduce from the Stop Loss Value if Price Moves Favorably
This setting allows traders to specify a factor by which the stop loss value is reduced as the price moves favorably, tightening the stop loss to protect profits. It’s designed to make the stop loss pivot closer to the current asset price without needing a pivot point change, thereby enhancing the protection of gains. A zero value disables this feature, providing flexibility in stop loss management based on market conditions and individual trading strategies.
Additional Incremental Factor Percentage on Pivot Change
This setting applies an additional percentage increase to the “Factor to reduce from the stop loss” value, but only at the occurrence of the next pivot change. It is specifically designed to adjust the base trailing pivot value by incorporating the previously determined reduction factor into the calculation for the new stop loss setting. This enhancement is cumulative, meaning it leverages the “Factor to reduce from the stop loss” adjustment to make subsequent stop loss adjustments increasingly tighter with each pivot change. This functionality is particularly valuable for traders aiming to adapt their stop loss strategy more effectively to the evolving market conditions, ensuring a more dynamic and responsive approach to risk management
Base Settings:

Additional Settings:

Stop Loss Labels
You can view the stop loss values by choosing one of these options:

- ‘Percent to s/l’: This option shows the distance between the current price and the stop loss value, expressed as a percentage.
- ‘s/l price’: Display the stop loss price.
- ‘Extra percent’: The information displayed varies based on the type of stop loss:
- ‘Trailing Percentage’: Displays the actual stop loss percentage value after any reductions, if applicable.
- ‘Trailing SAR’: No extra information is displayed.
- ‘Trailing Pivot’: Displays the distance from the pivot line to the stop loss, expressed as a percentage. For buy signals, it’s the percentage between the high pivot and the stop loss. For sell signals, it’s the percentage between the low pivot and the stop loss.

Alerts
PPA includes various alert types for Tradingview.
How to setup PPA alerts with Tradingview:
There are several ways to add alerts to a tradingview chart, please refer to this tradingview tutorial:
https://www.tradingview.com/support/solutions/43000595315-how-to-set-up-alerts/
To add Pivot Points Algo alert you simply click the ‘Alert’ button in one of the described ways here, afterward at ‘condition’ dropdown select ‘PPA {version}’, then you will be able to select from the dropdown box the following alerts:
- BUY MAIN – Triggers only BUY MAIN signals.
- SELL MAIN – Triggers only SELL MAIN signals.
- BUY COMBO – Triggers only BUY MAIN and BUY MINI signals.
- BUY MAIN AND FIRST MINI BUY -Triggers only BUY MAIN and the first following BUY MINI.
SELL MAIN AND FIRST MINI SELL – Triggers only SELL MAIN and the first following SELL MINI.
BUY & SELL MAIN AND FIRST BUY & SELL MINI – Triggers MAIN BUY or SELL signals and it’s their first MINI. - SELL COMBO – Triggers only SELL MAIN and SELL MINI signals.
- BUY & SELL MAIN – Triggers BUY MAIN and SELL MAIN signals.
- To ALL Signals – Triggers all signals above.
- STOP LOSS EXECUTED – Executes when stop loss is triggered (‘3’ for a stop-loss exit Buy signal, ‘-3’ for a stop-loss exit Sell signal)
On the alert message popup you will receive a signal code as follows:
For Main Signal codes:
- Buy [1]
- Sell [-1]
For Mini Signal codes:
- Buy [2]
- Sell [-2]
- Exit LONG [3]
- Exit SHORT [-3]

![]() You can use different ‘Options’ for the alert like ‘Once Per Bar’ or ‘Once Per Bar Close’. Selecting ‘Once Per Bar‘ will trigger an alert one time in a bar, once a signal occurs, however, it does not mean the bar will close with that signal. Please refer to false breakouts. and Does PPA Repaints?
You can use different ‘Options’ for the alert like ‘Once Per Bar’ or ‘Once Per Bar Close’. Selecting ‘Once Per Bar‘ will trigger an alert one time in a bar, once a signal occurs, however, it does not mean the bar will close with that signal. Please refer to false breakouts. and Does PPA Repaints?
![]() What to also receive stop-loss codes when alert triggers? enable this option:
What to also receive stop-loss codes when alert triggers? enable this option:
![]()
![]() How to set up PPA Alert:
How to set up PPA Alert:

Color Bars
Enabling Color Bars can enhance your understanding of how the trend goes, this method of bar coloring is preferred by some traders.
![]() You can enable ‘Color Bars’ from ‘STYLE’ Section from PPA settings:
You can enable ‘Color Bars’ from ‘STYLE’ Section from PPA settings:

Strong bar colors
A Strong color of a bar shows us that we are at a strong uptrend or downtrend.
For example, using the default color scheme (green and red), a strong green bar means a strong uptrend and a strong red bar means a strong downtrend.
Weak bar colors
Weak color shows us that the string trend is weakening and might reverse to the opposite direction.
![]() Here is a chart example:
Here is a chart example:

Scheme colors
You can change the scheme colors of the PPA by changing “Signals Color Scheme” in the ‘STYLE’ section, this will affect all Pivot Points Algo colors (Signal colors, Pivot lines colors, bar colors, etc…).
There are few scheme settings to choose from:
- Classic – Default
- Black/White – as name suggests.
- Sky – blue/white variant colors.
- Custom (Default, allowing you to set the colors in ‘COLORS’ Section)

![]() By selecting ‘Custom’ Scheme in the dropdown, you’ll be able to set PPA colors in the ‘COLORS’ section, to your prefered colors.
By selecting ‘Custom’ Scheme in the dropdown, you’ll be able to set PPA colors in the ‘COLORS’ section, to your prefered colors.
False Breakouts
False breakouts are pivot breakouts that happen but do not hold to trigger Buy or Sell signals (Applies for Main and Mini signals).
For example, Candle High touches an upper pivot line but does not close above the pivot line, we get a false breakout.
These False pivot breakouts are shown by dashed lines. Additionally, a false breakout can happen if OTC NoiseFilter filtered a pivot breakout which is also shown as a dashed line.

Strategies with Pivot Points Algo
There are many different ways you can use PPA, here we’ll describe a few confirmation strategies:
- Base Strategy: Use PPA signals for entries along with one of PPA stop-loss to limit risk and lock profit. You can always experiment and combine your own methods with PPA.
- Next Candle Sell: Buy at breakout and sell at next candle close or X candles afterward.
- Mini Confirm: After the Main Signal, wait for Mini Signal to confirm Main Signal to enter a position.
- Multi Time frame: You can use two PPA’s with a split-screen while each screen has a different time frame. First, the higher time frame needs to show the direction of the trend and the lower time frame will confirm the entry.
- DTrendmeter: Combine PPA with DTrendmeter, trending analysis indicator to filter signals, a private indicator which you receive upon subscription to PPA.
- Combine with your own methods: You can always experiment and combine PPA with your own methods, you might be surprised by the results.
![]() As the author of Pivot Points Algo, I am frequently surprised by how versatile PPA is. Users find a variety of ways to use PPA solo or with other indicators.
As the author of Pivot Points Algo, I am frequently surprised by how versatile PPA is. Users find a variety of ways to use PPA solo or with other indicators.
![]() Are you looking for additional features? Are you looking for more strategy ideas and need support? Do not hesitate to contact us here.
Are you looking for additional features? Are you looking for more strategy ideas and need support? Do not hesitate to contact us here.
DTrendmeter
Upon subscription, to Pivot Points Algo you receive DTtrendmeter, a private trend indicator for free!
Features of DTrendmeter:
- Analysis of fast, medium, and long trends.
- Use it along with Pivot Points Algo to filter signals.
- Trends time frame can be changed from the DTrendmeter setting.
- Supports alerts including Combo alerts that trigger based on two trend changes to a specific direction.
- Dynamic Alerts can work to signal automated bots. (change alert message from settings)
- Main Trend (Bottom Columns) – a long-term trend of the general direction the market is taking. As mentioned before, we want to trade with the trend. Shown as gradient green and red columns at the bottom. Strong color (bright) reflects a strong trend while a weaker color (dark) reflects a weaker trend that might reverse.
- Medium Trend (Dotted Lines) – an intermediate-term trend showing the medium-sized trend. Can be used for swing trading and confirming the short trend (see below). Shown as red and green dots.
- Minor Trend (Solid thin line) – a minor trend is the most sensitive trend and is used to fine-tune or early enter a trade. A medium-trend with the same direction as the minor trend can help us target the current short-term trend. Shown as a cyan-green/red thin line.

Overbought and oversold regions
DTrendmeter Alerts and Main Trend Sensitivity
DTrendmeter uses the latest dynamic alerts providing more flexibility for your alerts.
You can also change the Main trend sensitivity training from the values 1 to 5 (1 most sensitive while 5 less sensitive)

Combine DTrendmeter with PPA
You can combine DTrendmeter (DT) to filter signals from pivots points algo.
There are two ways to filter signals from pivot points algo:
- Active – We attach DTrendmeter to PPA to automatically filter signals based on DTrendmeter trends. PPA buy or sell signals will appear only based on DTtrendmeter selected trends direction.
- Passive – Use PPA and DTrendmeter in conjunction, and manually decide the direction same as any other indicator you use.
![]() For ACTIVE mode, DTrendmeter must be active in the chart layout for PPA to recognize it.
For ACTIVE mode, DTrendmeter must be active in the chart layout for PPA to recognize it.
To activate the ACTIVE method do the following:
Goto PPA settings and scroll down to ‘EXTERNAL FILTERING INDCIATOR’
.
From the ‘External indicator connection for filtering‘ select one of the following:

![]() Can also be combined with additional indicators of mine like MA+
Can also be combined with additional indicators of mine like MA+
![]() Demonstration video for adding DTrendmeter combined with PPA (Active filtering):
Demonstration video for adding DTrendmeter combined with PPA (Active filtering):
XRAY Price Action Indicator
The XRAY is at most price action indicator helping you detect the current direction of the asset.
The XRAY can also be used as a helper and/or filter for the Pivot Points Algo ( PPA ).
As Helper, if you use it along with Pivot Points Algo.
As Filter, if you attach it XRAY to Pivot Points Algo (from Pivot Points Algo Settings), it will show only PPA signals based on the direction the XRAY indicators indicate. (Basically the same as attaching DTrendmeter to PPA ).
Explanation of the signal symbols:
- Checkmark -“🗸”: Change of direction of the trend based on price action. A GREEN up label for an up trend and a RED down label for a downtrend.
- ‘V’: detection of unusual high volume (disabled by default, can be enabled in settings)
- ‘BC’: detection of a very big candle (disabled by default, can be enabled in settings).
![]() You can receive multiple signals on the same candle-like -” 🗸/BC” which means a change in direction (price action checkmark) and Big Candle.
You can receive multiple signals on the same candle-like -” 🗸/BC” which means a change in direction (price action checkmark) and Big Candle.
Some XRAY parameters:
X-RAY Pattern Sensitivity: A powerful filter based on specific candle patterns/price action is useful to filter false main and mini signals.
‘Strong’ is strict, giving pattern reversals (long or short trend) on very specific patterns., while ‘Normal’ is more flexible it gives more x-ray patterns and gives more opportunities for more signals, Using ‘Loose’ has the most x-ray patterns therefor will change trends more frequently and give more possible PPA signals than ‘Normal’.
If you are using this indicator to filter PPA signals, you should consider setting Pivot Points Algo built-in XRAY to ‘NONE’.
Candle Colors: Color the bars based on the signal. (default colors are GREEN for uptrend and RED for downtrend)
Force to use chart time frame for volume/candle filters:

Note that in the XRAY settings you can select a higher time frame which means that detections of patterns will be over the higher time frame including big candle and high volume (unless specified differently in XRAY settings).
Below chart use 6 hours time frame in 1 hour chart.
 🗸
🗸
Have a question? Feature Request? Get Support Here
There are two main ways to get support:
- By filling out the contact form at https://algo.win
- Contact Damn103 directly via Tradingview: https://www.tradingview.com/u/dman103/
- Join our new discord server.
